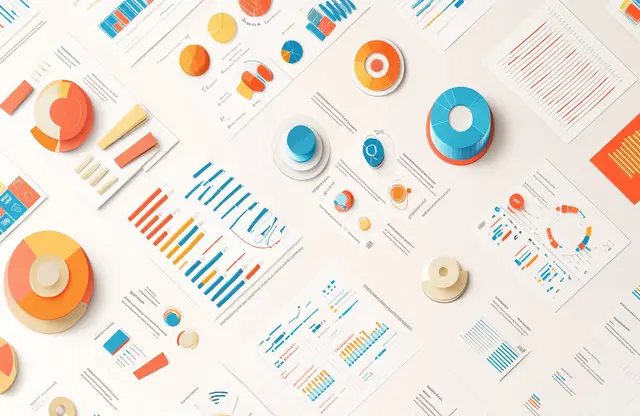
In today’s fast-paced digital world, 2D infographics have become a popular way to simplify complex data. Whether you’re looking to capture your target audience’s attention or add a creative design twist to your marketing strategy, 2D infographics are an excellent choice. They combine visuals with information, making it easier to convey key messages. With the rise of 2D infographics video formats, brands can present their data engagingly and impactfully, making dry stats come alive. This article will explore how to use these visuals effectively.
We’ll dive into what infographic design is and how 2D infographics fit into graphic design. You’ll also learn why these visual tools are essential, the different types of 2D infographics, and helpful design tips to improve your approach. Whether you’re a seasoned marketer or just starting, mastering 2D infographics can elevate your communication efforts and resonate with your audience.

What is Infographic Design?
Infographic design is about turning data, ideas, or information into visuals that are easy to understand and engaging. Instead of using just words, infographics use pictures, charts, and diagrams to explain complicated topics. This makes them useful in content marketing because they grab attention and make information easier to process. Whether you’re sharing statistics, explaining steps, or telling a story, infographics make everything clearer and more interesting, improving the customer experience.
There are different types of infographics, like static designs and 2D infographic videos. These videos mix motion graphics with data, and both formats can be customized to fit a brand strategy or specific project. Infographics are also popular on social media and websites because they boost engagement. When done right, they not only look good but also make it easier for people to remember the information.

What are 2D Infographics in Graphic Design?
2D infographics in graphic design are a way to share ideas, data, or processes using simple visuals like charts, images, and diagrams. They help make complex topics easier to understand by presenting the information in a clear, engaging way. This makes 2D infographics a great tool in the content creation process. They are commonly used in marketing, educational materials, and reports to communicate key messages effectively.
Besides static infographics, 2D infographic videos are also gaining popularity, especially on social media. These videos use motion graphics and animation to make the content more engaging. Since these formats are highly customizable, they can fit any brand strategy while providing high-quality visuals. This helps brands better communicate with their audience and improve the customer experience.

Importance of 2D Infographics
2D infographics are an essential tool in modern communication, offering a simple yet effective way to present data and ideas. They help businesses overcome creative bottlenecks by turning complex information into engaging visuals. Whether it’s for marketing, social media, or reports, they can make content more informative and impactful, supporting visual storytelling and audience engagement.
1. Simplifies Complex Information
2D infographics simplify difficult topics by transforming data and statistics into easy-to-understand visuals. They break down information into bite-sized pieces, making it more accessible to a wide audience. This is especially helpful for businesses needing to convey key points quickly without overwhelming their audience.
2. Enhances Visual Storytelling
Through visual storytelling, 2D infographics create a narrative that grabs attention and keeps viewers engaged. They use elements like charts, diagrams, and images to guide the audience through the information. This method helps brands convey their message more clearly and memorably, improving communication.
3. Overcomes Creative Bottlenecks
2D infographics help overcome creative bottlenecks by providing a structured approach to presenting data. Instead of relying on lengthy text or overwhelming statistics, a graphic designer can use infographics to organize content in a visually appealing way. This method improves workflow and speeds up the content creation process.
4. Engages Audiences on Social Media
2D infographic videos for social media are highly engaging. They combine animation and visuals to capture attention quickly, making them ideal for platforms where users scroll rapidly. These videos are also easily shareable. Which increases the chances of your content reaching a broader audience and boosting engagement.
5. Offers Informative and Memorable Content
Infographics are both informative and visually appealing, making the information easier to remember. When people see well-designed visuals, they are more likely to remember the data presented. This helps businesses communicate important messages in a way that sticks with their audience, adding long-term value.
6. Saves Time for Graphic Designers and Illustrators
For a graphic designer or illustrator, creating 2D infographics can save time compared to more complex design projects. Infographics allow designers to present data visually without needing intricate design work. This efficiency helps businesses produce high-quality visuals quickly, allowing them to focus on other priorities.

Types of 2D Infographics
2D infographics are a powerful tool for presenting information visually. They make complex data easier to understand and can enhance clarity in marketing campaigns and reports. Different types serve specific purposes, depending on the content you want to present. In this section, we’ll explore various types of 2D infographics that can help businesses communicate effectively.
1. Statistical Infographics
Statistical infographics focus on presenting data and numbers in a visually appealing way. They typically include charts, graphs, and percentages to break down complex information. This type of 2D infographic is ideal for marketing campaigns that rely on data-driven results, making the information easier to digest for the audience.
2. Timeline Infographics
Timeline infographics are used to show events or processes in chronological order. These are useful when you want to create infographics that explain the history of a company, project milestones, or the progress of a marketing strategy. Their structured layout adds clarity to the flow of events, making it easy for viewers to follow.
3. Process Infographics
Process infographics are designed to explain how something works in step-by-step detail. Whether it’s a product assembly or a business workflow, this type of 2D infographic is perfect for demonstrating processes. Storyboards can be incorporated into these designs to guide the viewer through each step visually.
4. Comparison Infographics
Comparison infographics are used to put two or more options side by side for easy evaluation. They are ideal for comparing products, services, or features in marketing campaigns. By using simple visuals, they help audiences see the differences and similarities quickly, supporting better decision-making.
5. Informational Infographics
Informational infographics are a great way to break down and explain key concepts. They combine short text sections with visuals, making them perfect for education and general information sharing. These 2D infographics often serve as the foundation for infographic design services that aim to simplify complex topics.
Each type of 2D infographic has its strengths, depending on your communication needs. Whether you’re using them for marketing campaigns, reports, or educational purposes, the right infographic can help improve clarity and engagement. When businesses create infographics tailored to their goals, they make the information more memorable and impactful.

Design Tips for 2D Infographics
Designing 2D infographics requires a balance between aesthetics and functionality. The goal is to create impactful visuals that present important information clearly and concisely. Whether you’re working with data and statistics or storytelling, the right design tips can elevate your 2D infographics. Here are some essential tips for those looking to create compelling and engaging infographics.
1. Keep It Simple
Simplicity is key when designing 2D infographics. Too much clutter can distract viewers from the message. Use only the most important information and present it. Stick to basic visuals and minimal text to ensure your infographic remains clean and easy to understand.
2. Focus on Data Visualization
Effective data visualization is crucial for infographics that display data and statistics. Use charts, graphs, or icons to represent the data visually. This makes the information easier to grasp at a glance and helps the audience understand patterns or comparisons quickly.
3. Use Consistent Branding
Maintaining consistent colors, fonts, and style is essential to keep your infographic visually cohesive. For businesses, align your 2D infographic’s design with your brand’s identity. This consistency will make your work more recognizable and professional, especially when creating 2D animated infographics for marketing.
4. Prioritize Readability
Use large, legible fonts for headings and important points. Organize content in a way that makes it easy to read and follow. Avoid overloading your infographic with too much text. This will make your design more informative and visually appealing, ensuring your audience doesn’t lose interest.
5. Create Impactful Visuals
To create impactful 2D infographics, choose strong visuals that complement the information. Whether you’re working with icons, illustrations, or 2D animated infographics, ensure your visuals highlight the key points without overshadowing the data.
6. Highlight Key Information
Make sure the most important information stands out. Use color contrast or larger fonts to draw attention to key data points. This helps guide the viewer’s eye and ensures the takeaway is clear and memorable.
7. Use Animation Strategically
If you’re designing 2D animated infographics, use animation thoughtfully. Simple animations like transitions or moving elements can keep viewers engaged without overwhelming them. This approach is especially useful for engaging audiences on social media and other dynamic platforms.
By following these tips, you can design 2D infographics that are both visually appealing and informative. Whether you’re looking to create compelling visuals or create impactful designs for data-heavy content, these strategies will ensure your message is clear and engaging.

Transform Your Data with 2D Infographics by Synapse
2D infographics are an excellent way to simplify complex information and tell stories through visuals. They are very useful in marketing strategies, educational materials, and more. These infographics make data easy to understand by turning it into simple visuals. With high-quality design, businesses can better connect with their audience, using either static images or animated infographic videos.
If you need compelling 2D infographics to share your brand’s message, Synapse can help. As one of India’s top creative agencies, our services include graphic design, business communication design, brand collateral design, and more. Visit our Showcase page for samples, reach out to us via WhatsApp, or call us at 1800 121 5955 (India), email at contact@synapse.com, or through our Contact Form. Let’s create impactful visuals together!


